Quarto Website

Quarto workflow

Art by Allison Horst

Structure of a Quarto document

3 basic components:

  • Metadata (YAML aka Yet Another Markup Language)

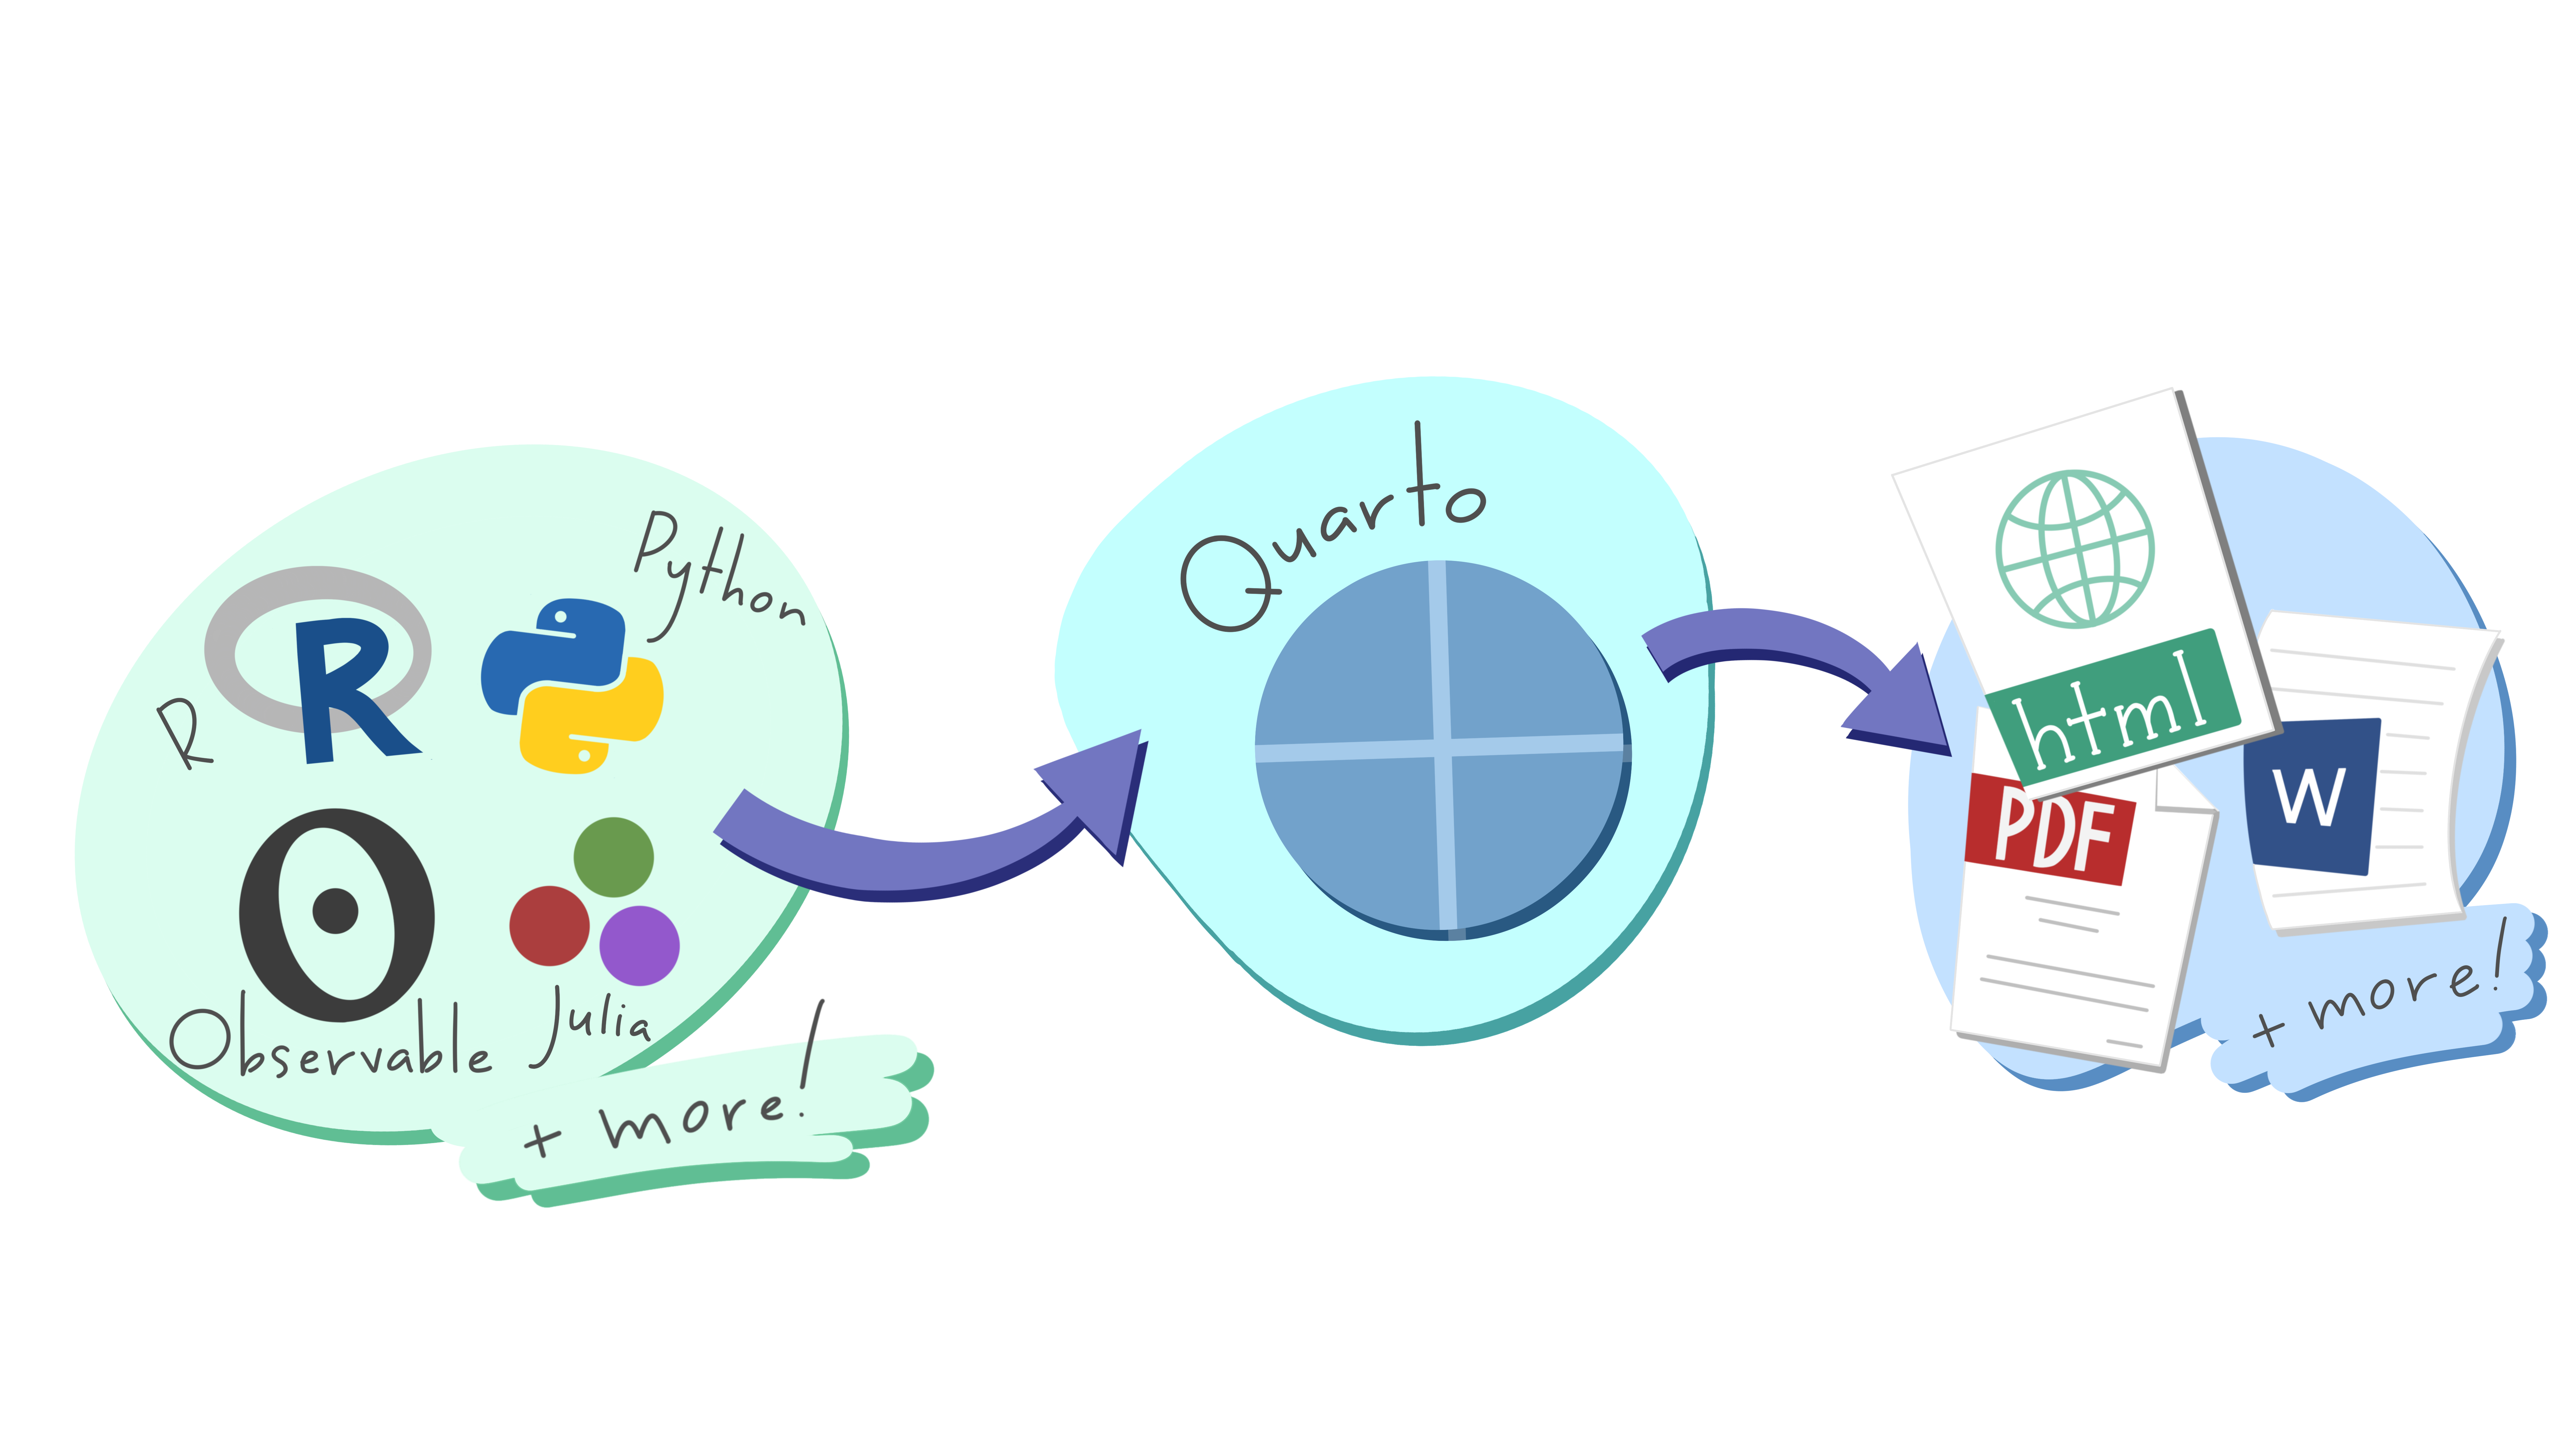
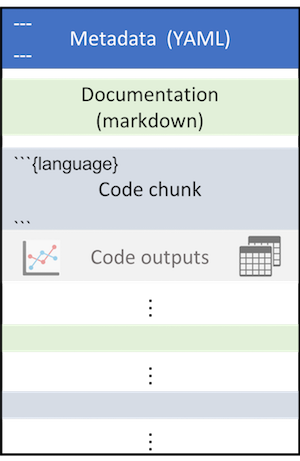
  • Text for documentation (markdown + other few tricks)

  • Code (chunks) with your analysis (R and friends)

Structure of a Quarto website

For a website, each webpage is going to be its separate quarto document. To create a website, you need one extra YAML file that will stitch all those pages together. Enters: _quarto.yml

_quarto.yml can be seen as a config file that provides website options, such as style, name, navigation tools and more. Here is its content for this website:

project:
  type: website
  output-dir: docs

website:
  title: "Publishing Quarto websites with GitHub pages"
  navbar:
    left:
      - href: index.qmd
        text: Intro
      - href: intro.qmd
        text: "Quarto Websites" 
      - href: github.qmd
        text: "Publish on GitHub"
      - href: customize.qmd
        text: "Do it in Style"
      - about.qmd
    right:
      - icon: github
        href: https://github.com/UCSB-Library-Research-Data-Services/ucldw26-quarto-websites


format:
  html:
    theme:
      - cosmo
    css: styles.css
    toc: true

Images

Did somebody say cat?? Sorry cute cat?! You can insert an image using the markdown syntax: ![Fig caption](path/to/image)

A cat upside down


You can also customize alignment, size and more… add options with {fig-align="right" width=50%}

A smaller cute cat upside down… on the right

How about some math?

You can insert LaTeX math expressions into your page or document. What’s particularly nice about Quarto is that you can use the math formatting from LaTeX without having to buy into the entire LaTeX environment. For example, you might want remind your readers that

\[e = \lim _{n\to \infty }\left(1+{\frac {1}{n}}\right)^{n}\]

and it’s also true that

\[e=\sum \limits _{n=0}^{\infty }{\frac {1}{n!}}=1+{\frac {1}{1}}+{\frac {1}{1\cdot 2}}+{\frac {1}{1\cdot 2\cdot 3}}+\cdots\]

And don’t forget that \(e^{i\pi} = -1\).

Adding code

So I can build a website that leverages R (or Python) code!?

Yep!! And as with any other R script, it is good practice to start by loading the libraries you are going to need for your analysis / website content.

Load your libraries

library(tidyverse)
── Attaching core tidyverse packages ──────────────────────── tidyverse 2.0.0 ──
✔ dplyr     1.2.0     ✔ readr     2.1.6
✔ forcats   1.0.1     ✔ stringr   1.6.0
✔ ggplot2   4.0.2     ✔ tibble    3.3.1
✔ lubridate 1.9.5     ✔ tidyr     1.3.2
✔ purrr     1.2.1     
── Conflicts ────────────────────────────────────────── tidyverse_conflicts() ──
✖ dplyr::filter() masks stats::filter()
✖ dplyr::lag()    masks stats::lag()
ℹ Use the conflicted package (<http://conflicted.r-lib.org/>) to force all conflicts to become errors
library(lterdatasampler)

Mmm… this is a lot of information we would like to hide.

Take two

Adding an execution option: #| message: false to the code chunk will let us hide the warning messages when rendering the document

library(tidyverse)
library(lterdatasampler)

Yeah!!!

More on output options: https://quarto.org/docs/computations/execution-options.html#output-options

First plot

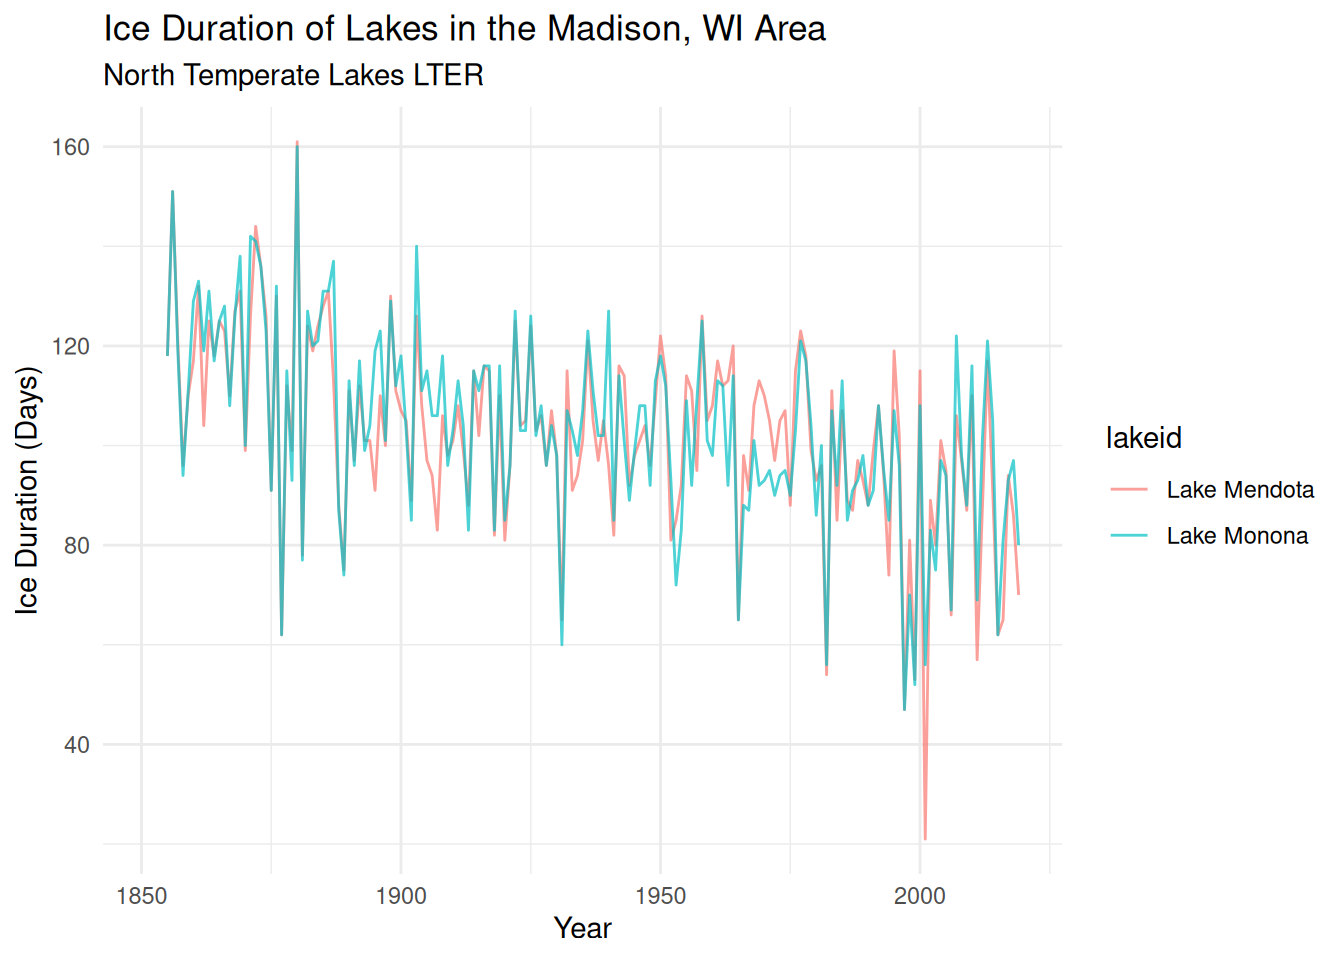
The Long Term Ecological Research (LTER) North Temperate Lakes (Madison, WI) research site has one of the longest time-series of Temperatures and Lake Ice Duration. The study and analysis of lake ice formation can inform scientists about how quickly the climate is changing, and are critical to minimizing disruptions to lake ecosystems. We can examine the ice duration of Lake Mendota and Lake Monona.

BTW you can add callout blocks super easily!!

TipFun Fact

Did you know that Joni Mitchell’s album “Hejira” art is her skating on Lake Mendota in 1976 !? https://wisconsinlife.org/story/joni-mitchell-skates-on-lake-mendota-and-into-music-history/

More on callout blocks: https://quarto.org/docs/authoring/callouts.html

Here is the code chunk for our first plot using ggplot2:

ice_duration <-
  ggplot(data = ntl_icecover, aes(x = year)) +
  geom_line(aes(y = ice_duration, color = lakeid), alpha = 0.7) +
  theme_minimal() +
  labs(x = "Year", y = "Ice Duration (Days)", title = "Ice Duration of Lakes in the Madison, WI Area", subtitle = "North Temperate Lakes LTER")

ice_duration
Warning: Removed 2 rows containing missing values or values outside the scale range
(`geom_line()`).

We might want to hide the code

Of course there is an option for that: #| echo: false

Or collapse it

Try #| code-fold: true if you want to get fancy

Code
ice_duration <-
  ggplot(data = ntl_icecover, aes(x = year)) +
  geom_line(aes(y = ice_duration, color = lakeid), alpha = 0.7) +
  theme_minimal() +
  labs(x = "Year", y = "Ice Duration (Days)", title = "Ice Duration of Lakes in the Madison, WI Area", subtitle = "North Temperate Lakes LTER")

ice_duration

more on code chunk options here: https://quarto.org/docs/output-formats/html-code.html

HTML widgets

Add an interactive plot

library(plotly)

ice_duration %>% ggplotly()

Add a map

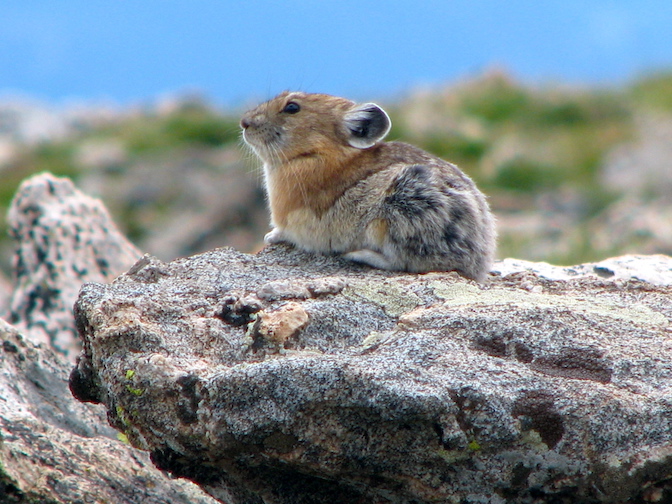
Researchers at the Niwot Ridge Long Term Ecological Research Site (NWT LTER) seek to study and monitor the health of the Colorado Rockies over time. Because of external factors like climate change, it’s more important than ever for scientists to understand how and why the Rockies are changing.

The American pika (Ochotona princeps) is a key species present at the NWT LTER. Despite their small size, pikas can be very informative about the health of the ecosystem. If pikas are more stressed, it can suggest that their habitat has declined in quality.

Adult pika at the Niwot site, Sara McLaughlin

Location of Pika Sampling Stations

library(sf)
library(leaflet)

# Prepare the data
pikas_sf <- st_as_sf(x = nwt_pikas, coords = c("utm_easting", "utm_northing")) %>% 
  st_set_crs("EPSG:26913") %>% 
  st_transform("EPSG:4326")

# Set the bounding box for the map
leaflet() %>% 
  addTiles() %>% 
  addCircles(data = pikas_sf, label = ~station)

Note: it is best practice to load all your libraries at the top of your Quarto document. Here we chose to do it out of order to highlight which package is used for each html widgets