I think I want more Data
I want to add more data
Focus more on data - Flush out what we want the end product to look like
Annotation vs geospatial data - importing rather than sketching layers - Raster/DEM - Lat/Long CSV file - uploading your won dataset and/or finding a dataset in living atlas
Features have attributes - a data table/tabular data - columns have fixed data types (a lot of them) - for example bikes
Types of data:
- Vector: Difference between point, line, and polygon
- Raster: an array of values that can be used
- Single band
- Multibands
How to add a new data layer: - Import point data from a csv, lat/long csv file - Raster/DEM - Importing or uploading a dataset vs finding a good dataset in living atlas
- Facilities data (buildings)
- DEM (expanded to the foothills)
- Bike paths (a newly extended to roads version)
- Bus stops (lat-long csv file. for when you get tired)
Esri ArcGIS Online Credits:
All ArcGIS Online accounts created under the UCSB site license are allocated 1000 service credits per license year.
Transactions: Some analysis operations use credits. For more information, visit Esri’s Understand Credits Page.
Manage your content: Periodically review and delete unnecessary content.
Data Stewardship: Objects stored in ArcGIS Online should be considered ephemeral. The content depends on your access to the UCSB Library’s Higher Education Site License.
Narrative
- The story: we want to route a steep, safe bike ride off campus
- Gather more data: we will add layers to our working map and save it in our own space (to review workshop 1).
- Add DEM
- Calculate slope from dem
- Overlay slope onto lines (ie: edit attribute table)
- Highlight steepest route (max slope)
- Play with slider: Counts & Amounts
- The layers: Basically the same layers as workshop 1, but with larger extents. ** DEM around campus ** Paths based on a provided and expanded extract from Open Street Maps ** Bike racks: A csv file hosted on ArcGIS Online that we will convert to a data layer (or a non-editable data layer that people will do a save-as on)
- Outline of analysis ** Turn the DEM into a slope layer ** trace the inclines of the bike paths ** add bike racks to path interections *** we might need to buffer the bike racks to get them to intersect ** calculate the steepest route from the Library to a
Once your map has the slope raster and the road layer, go to raster analysis > Zonal Statistics as Table.
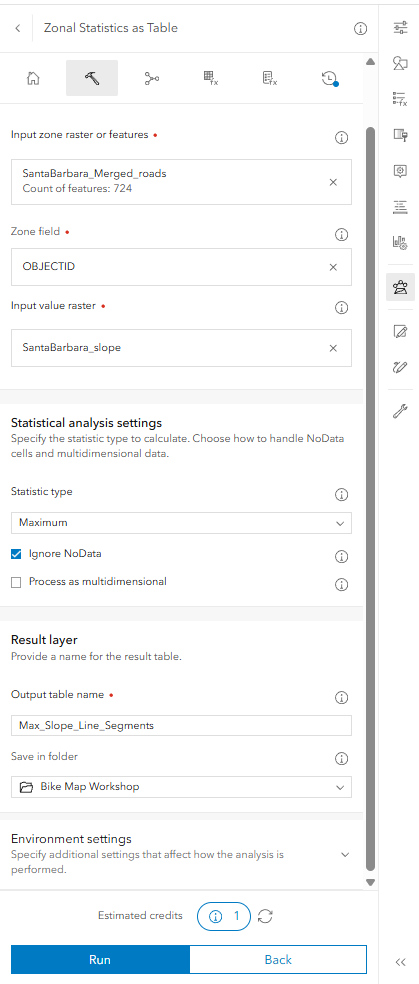
This is going to make a TABLE. Not a layer. Now we join the table back to the line file. Tools > Summarize data > Join Features Use the objectID. It might not be visible in the roads file.
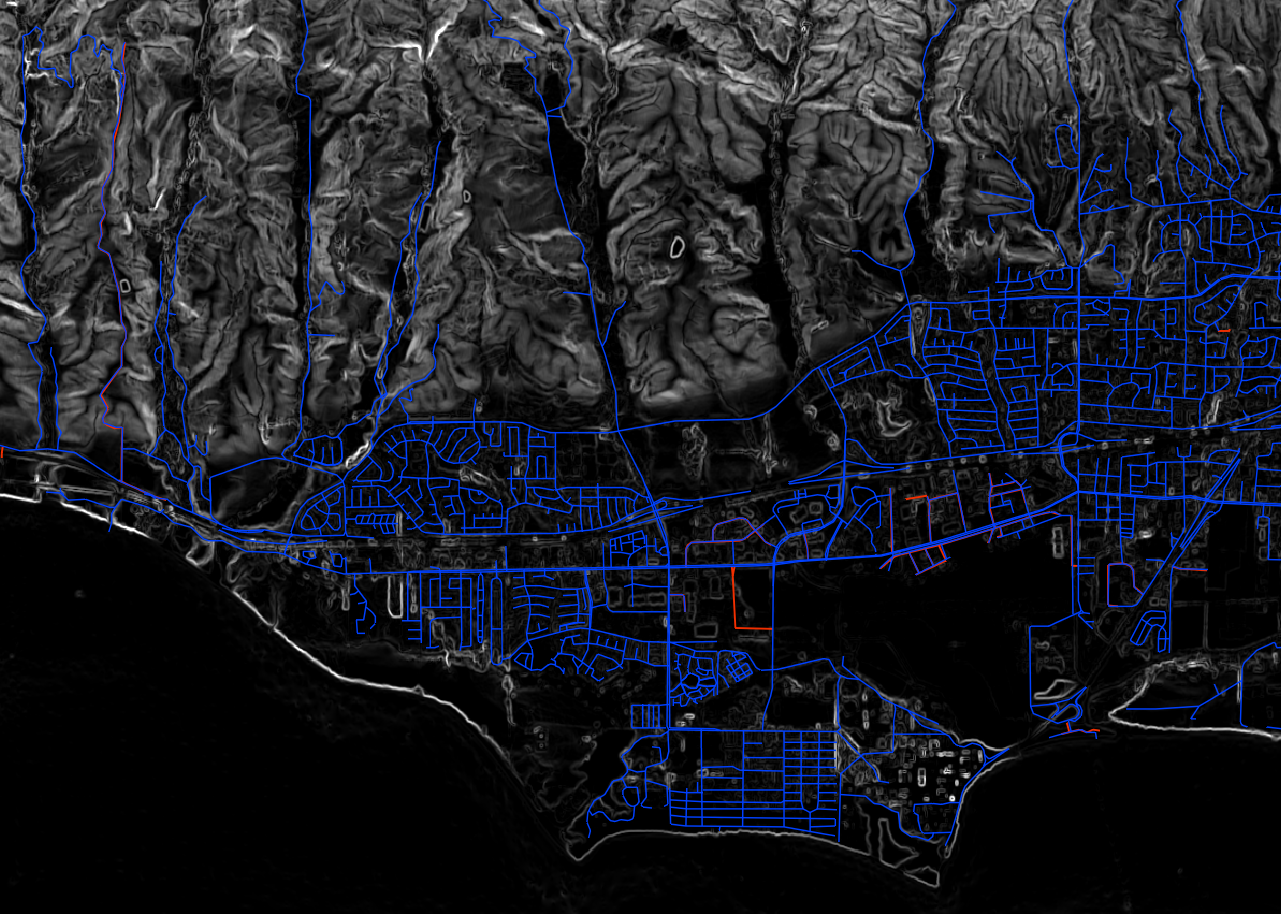
….