Bonus 2026 - What makes a good index?
Please use Canvas to return the assignments: https://ucsb.instructure.com/courses/32934/assignments/480162
Recall from class that an index IC on a column C in a table T is in effect a mini-table, kept in sync with T, that contains all the values of column C in order. If there are a million rows in table T, there will be a million values in index IC. If the values of column C are unique, the index will hold a million unique values. If column C takes on only a few possible values, then index IC will still have a million values, but many of those values will be repeated.
Suppose we are given a query that includes a constraint against column C, i.e., that includes WHERE C = someval possibly among other constraints. If the table has no indexes, then the database has no choice but to do a “full table scan,” i.e., to examine every table row. If the table is large that can be very costly. But if index IC exists, then to use index IC means that the database looks up the constraint value someval in the index to obtain a smaller number of table rows (just one row in the case of a unique index) to subsequently examine and match additional constraints against. The essential purpose of an index is to reduce the number of table rows that must be examined.
If the table has multiple indexes, the database will analyze the query constraints and the distributions of column values and pick what it thinks will be the most effective index to use for the given query.
An index can be created for a single column as in the example of IC above. But an index can also be created across multiple columns. For example, an index IC,D,E would index all tuples of values from columns C, D, and E.
For the purposes of this assignment we will be working with an SQLite database that has the same structure as previous class databases but in which the Bird_nests table has 2 million rows, each of which has been fattened to occupy multiple kilobytes. As a consequence, the database file is approximately 8GB. The database file can be found on workbench-1.bren.ucsb.edu at /courses/EDS213/big-fat.sqlite3.
To use it you will need to copy or download the database file to your own space.
You can open an SQLite database similarly to what we did with DuckDB:
sqlite3 big-fat.sqlite3 Note: the .tables, .schema, .exit functions are similar to the ones we used with DuckDB.
We will also be working with the following query:
SELECT Nest_ID
    FROM Bird_nests
    WHERE Site = 'nome' AND
          Species = 'ruff' AND
          Year = 1983 AND
          Observer = 'cbishop' AND
          ageMethod = 'float';
This query returns exactly one row.
Part 1 (5pts)
Answer the following questions.
Is there already an index on the Bird_nests table? If so, what is that index and will SQLite use it in the above query? Why or why not?
Will adding an index on a column not mentioned in the WHERE clause be used by the database? Why or why not?
Part 2 (20pts)
Query optimization, which falls under the general heading of “database tuning,” is a complex subject, as query performance depends on the query or queries being supported, the distribution and nature of the data, the abilities and characteristics of the query planner, and the costs of creating and maintaining indexes. Still, we can make a general observation about what makes for a good index (“good” meaning improving query performance here) by examining the effects of adding different indexes on the Bird_nests table and timing the above query.
Your task is to conduct at least 15 experiments. In each experiment perform the following steps:
- Create an index on a column or columns.
- Time the above query. (To time a query, execute it many times in a loop, and divide the total time required by the number of repetitions to get the average query time. Be sure to use this approach, as query times can be highly variable.)
- Drop the index (to avoid accumulating indexes on the table).
- Also, determine the number of distinct values in the index, i.e., the number of distinct values in the column or number of distinct tuples if the index is over multiple columns.
What experiments to run?
- Run an initial experiment with no added index. For this experiment only, record the number of distinct values as 1.
- Try adding an index on each column mentioned in the WHERE clause (e.g., Site): that’s 5 experiments right there.
- Try adding an index on a couple of columns at a time. Try at least the following combinations, but add others if you like:
- Site,Species
- Site,Observer
- Species,Observer
- Year,Observer
- Observer,ageMethod
- Try adding an index on 3-4 columns at a time.
When done, you will want your results in the form of a CSV file with three columns: label, average query time, and number of distinct values. If you use the label “none” for the initial experiment and the columns indexed as the label, your CSV file might resemble:
label,avg_query_time,num_distinct_values
none,#####,1
Site,#####,16
Species,#####,#####
Year,#####,#####
Observer,#####,#####
ageMethod,#####,#####
"Site,Species",#####,#####
"Site,Observer",#####,#####
...
For timing, you can use the Bash test harness you developed previously, or you can do your timings from R or Python if you prefer. Regardless of the language, ensure that you compute the average time it takes to perform the query as described above.
You can run your test harness manually for each experiment, and manually retrieve the number of distinct values for step 4 above. That’s just fine. But you can also automate the whole process; some hints for doing so are below. Be careful when running your test harness, as in the end you want just one row in your CSV file per experiment. Don’t get hung up on automating the experiments; that’s not a requirement.
Once you have your data, load it in Python or R and create a log-log scatter plot of the number of distinct index values (X axis) versus query time (Y axis). (Results will be difficult to see if both axes are not logarithmic.) If all goes well, your plot should resemble something like this:
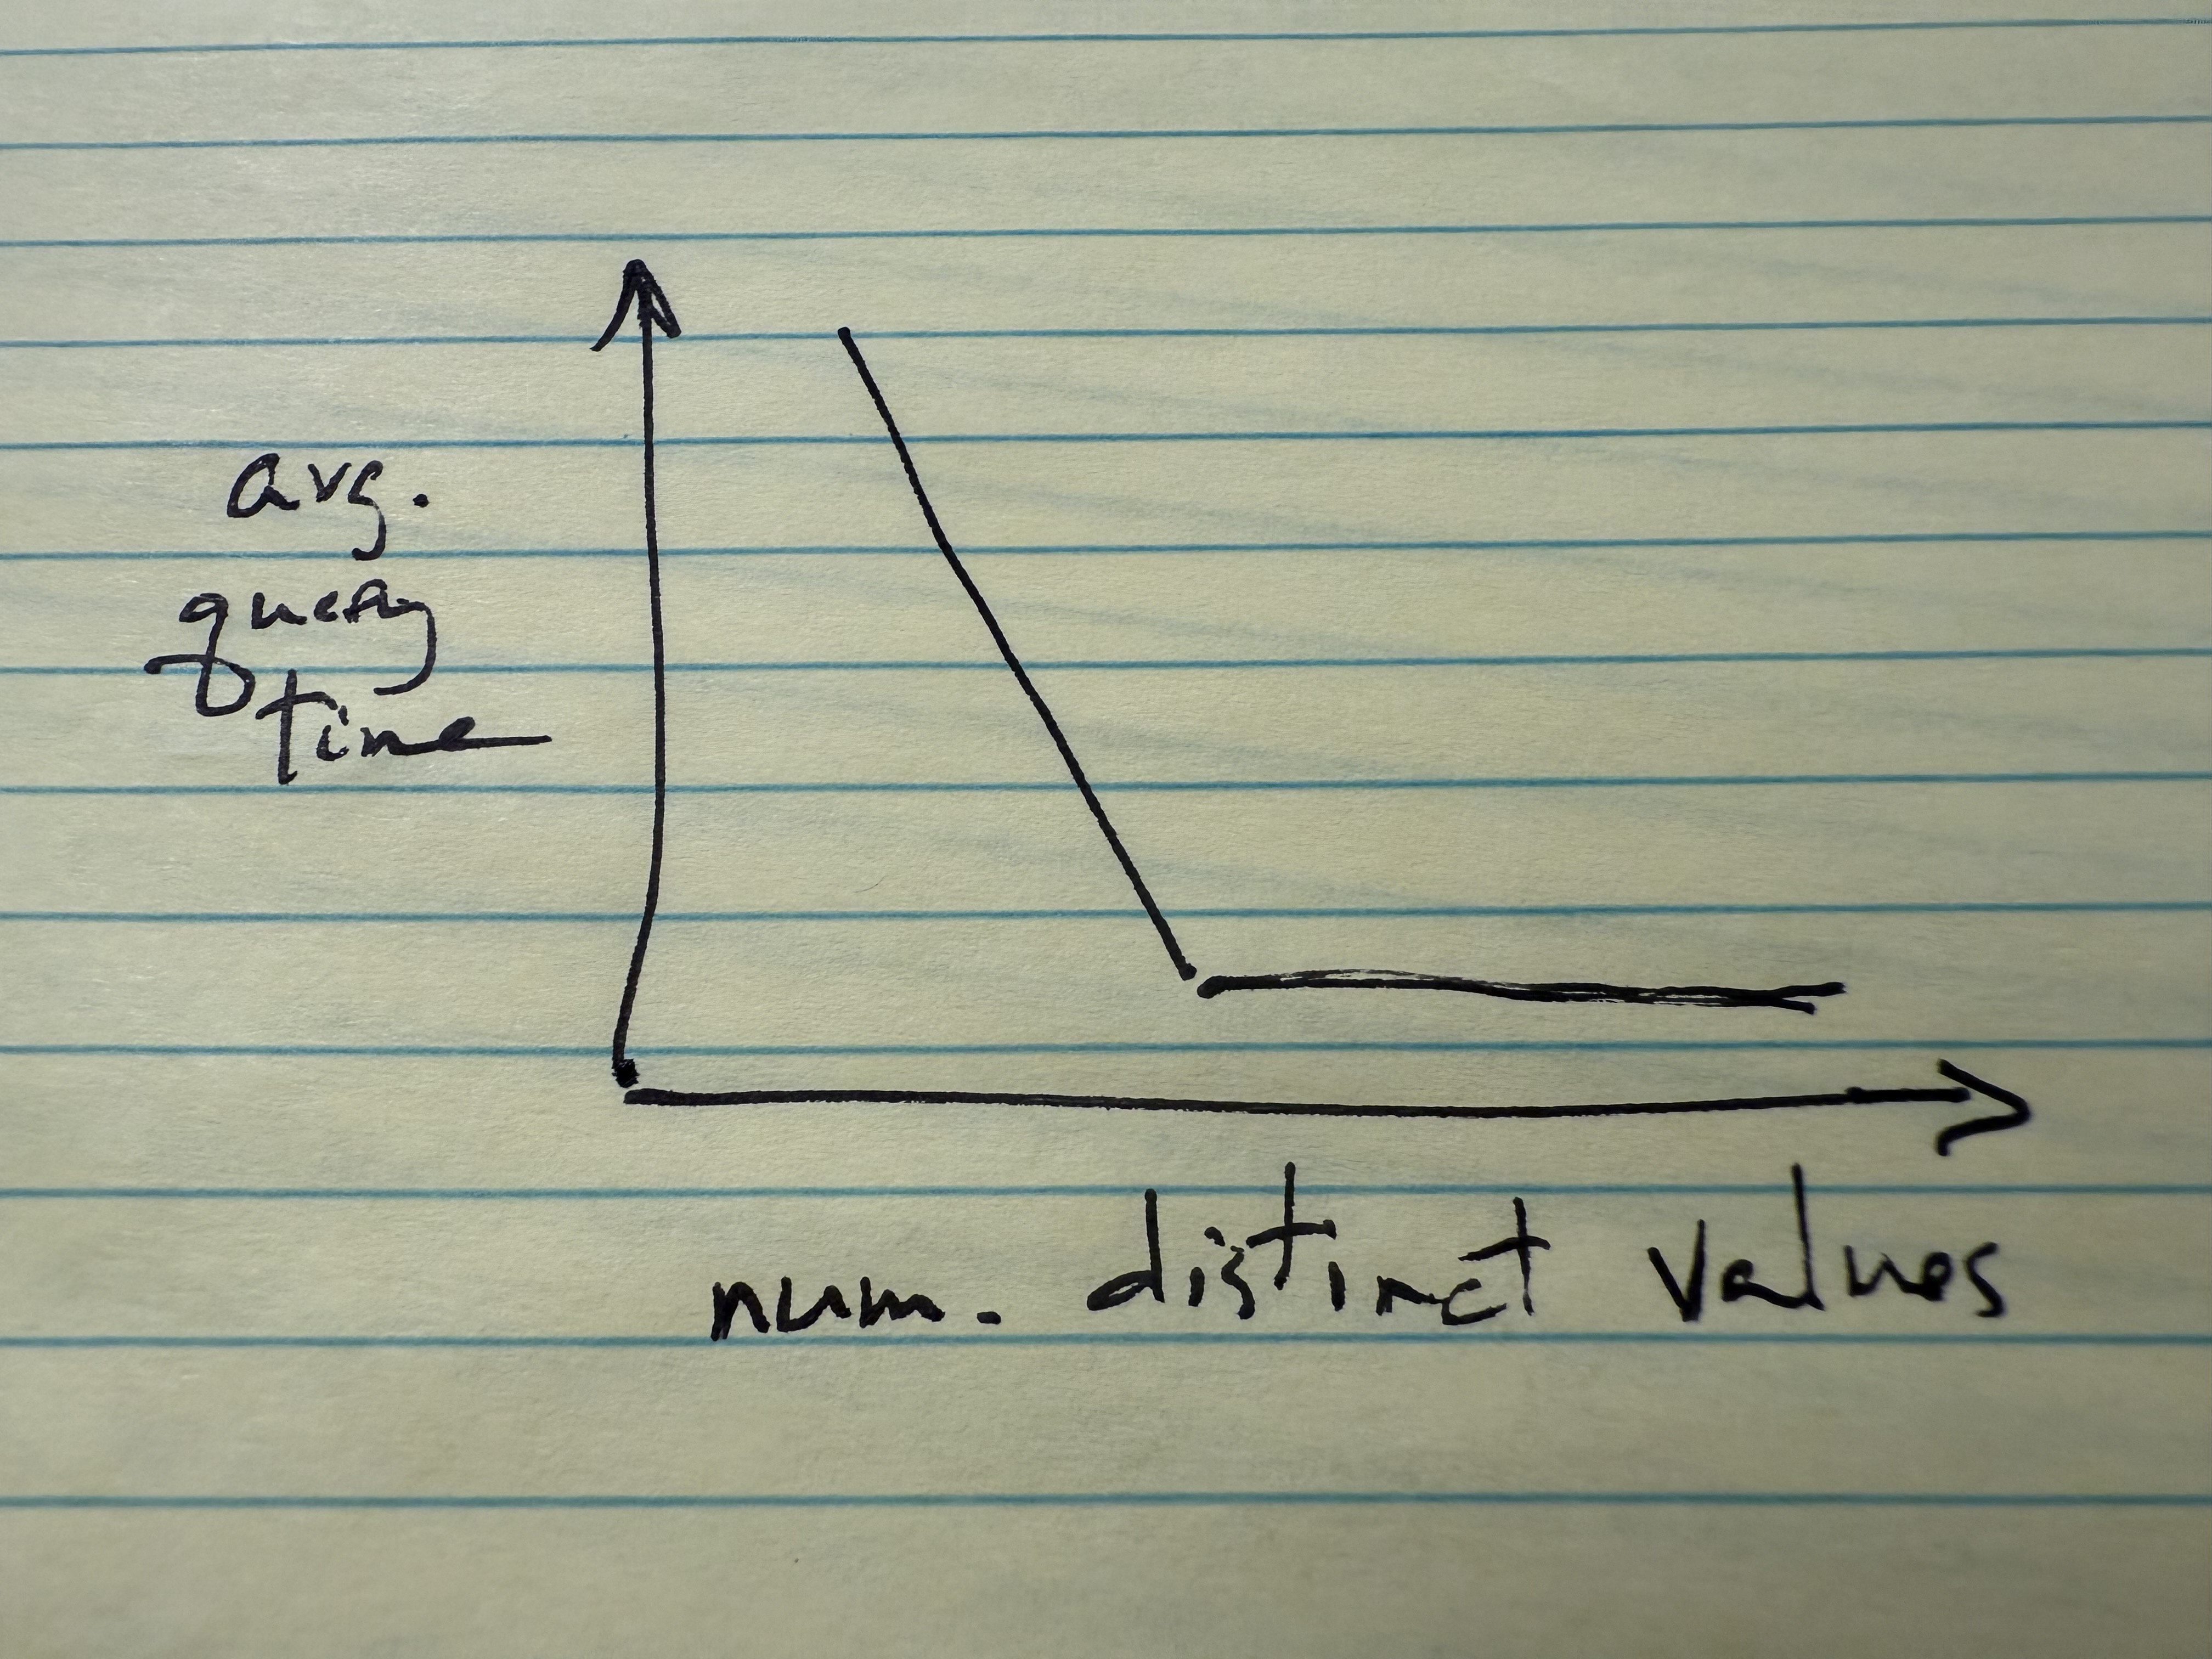
Recall that num_distinct_values = 1, the leftmost point on your scatter plot, corresponds to using no index at all.
Finally,
- Answer these questions:
- What relationship do you observe? Hypothesize why you see the relationship you do.
- What conclusion do you draw regarding what makes a good index?
- Upload all your work: your test harness, your analysis notebook, and your CSV file.
Total Credit: 25 points
Appendix 1: Modifying your Bash test harness
A few tips on modifying your Bash test harness to make it more useful for this assignment. First, if you find it annoying to have to try different numbers of repetitions to get positive and more precise timings, you can automate your script to try different numbers of repetitions until it achieves something reasonable. Here’s one idea:
num_reps=1
while true; do
    start=$SECONDS
    for _ in $(seq $num_reps); do
        sqlite3 $db_file "$query" >& /dev/null
    done
    end=$SECONDS
    if [ $((end - start)) -gt 5 ]; then
        break
    fi
    echo "Too fast, trying again!"
    num_reps=$((num_reps * 10))
done
This will try 1 repetition, then 10, then 100, etc.
Second, you can gather the number of distinct values by adding an sqlite3 -csv $db_file "$num_values_query" command and saving the output in a variable, and then echoing that variable out to your CSV file along with your other variables.
And third, if you make the column(s) you want to index an argument to your script, you can automate adding and dropping indexes by adding more sqlite3 commands.
Appendix 2: Connecting to SQLite from Python
# %pip install sqlite3

# Connect to the database
import sqlite3
conn = sqlite3.connect("/courses/EDS213/big-fat.sqlite3")
cur = conn.cursor()

# Execute a query
cur.execute("SELECT * FROM Site")
cur.fetchone()
Appendix 3: Connecting to SQLite from R
library(tidyverse)
library(DBI)
library(RSQLite)
library(dbplyr)

# Connect to the big database
conn <- DBI::dbConnect(RSQLite::SQLite(), "/courses/EDS213/big-fat.sqlite3")

# List the available tables
DBI::dbListTables(conn)

# query using DBI
DBI::dbGetQuery(conn, 'SELECT * FROM Site')
Probably best to not use dbplyr for this assignment as you want control over the query that is submitted and the result that is returned.